

I was reading the financial news last week, the kind of coverage that shows up every few months: valuations look stretched, a market correction might be close, but nobody knows when. It brought back a story I’ve heard in some version a dozen times. People who did everything right, saved for decades, hit their savings target right around 2008 - and then couldn’t retire on schedule because their portfolio dropped nearly 40% the year they were supposed to walk away. Some delayed retirement, working years longer than planned to let their savings recover. Some retired anyway, panicked when the market kept falling, and sold their stocks near the bottom - locking in losses that would have recovered if they’d waited.
I closed the article and asked myself the question I ask every few years. I’m 100% in equity right now. Should some of that be in bonds?
I checked the numbers. Short-term Treasuries have historically returned around 3-4% a year. The S&P 500 has returned closer to 10%. I stared at that gap and, like every other time I’ve run this exercise, talked myself out of buying bonds.
Why a bond bucket exists
During retirement, money gets pulled out of a portfolio every year to cover living expenses. If the equity market is down when that withdrawal happens, shares get sold at a loss to fund that year’s spending - and those shares are gone. They don’t get to grow when the market recovers, because they’ve already been sold. That’s a permanent loss, not a paper one.
A bond bucket’s main job is to prevent that. It’s a separate pool of money that covers expenses during the years the market is down, so nothing ever has to be sold at a loss. The rest of the time, it just sits there, unused. When the market is down - especially during a bear market or crash - living expenses get funded from the bond bucket instead, while equity is left alone to recover. That’s the whole point: avoiding a panic sale at the worst possible time.
Why a bond allocation based on a percentage may not work for you
Ask any financial media source how to protect against this and you’ll get some version of the same answer: own more bonds as you get older. John Bogle’s original version of this - “age in bonds” - says a 65-year-old should hold roughly 65% bonds and 35% equity (i.e., your age as the percent of your portfolio in bonds). It’s also, in Bogle’s own words, “a crude starting point” - not a formula, an approximation meant to be adjusted for individual circumstances.
Compare that to Warren Buffett’s instructions, laid out in his 2013 Berkshire Hathaway shareholder letter, for the trust that will hold cash for his wife: 90% in a low-cost S&P 500 index fund, 10% in short-term government bonds. He was explicit about why the 10% exists - so that during a bad stretch in the market, withdrawals come from the bond position instead of selling stocks at the wrong time.
Read that again next to Bogle’s number. Same underlying goal - don’t get forced into selling equity during a downturn. One version says hold 65% in bonds at age 65. The other says hold 10%. That gap is real, and it’s fair to say risk tolerance and personal experience explain at least part of it - Buffett has a documented, decades-long comfort with equity risk that many people don’t share, and Bogle was writing a general-audience rule meant to be conservative by default. What neither of them did, though, is start from one person’s actual expenses and calculate how much bond coverage that specific person needs to avoid selling at a loss. They both picked a number that reflected their own judgment, not a calculation tied to anyone’s actual spending in retirement.
A better question: how many dollars, not what percent
Instead of asking what share of the portfolio should sit in bonds, we should ask a different question: how much would need to be set aside in bonds to cover expenses if the market fell hard during your retirement and didn’t recover for a while? That’s a dollar amount, tied to actual expenses - not a percentage tied to your age.
Start with an honest, slightly padded estimate of annual expenses - say $150,000. While still working, the bond bucket can sit at zero, because a paycheck is covering expenses, not the portfolio.
The bucket gets funded once the paycheck stops - for example, the year before retirement, sized to however many years of cushion feels right, held in short-term bonds. After that, if the market drops, spending comes out of the bucket first, not the equity portfolio. When equity recovers enough that selling some of it means a gain instead of a loss, that gain gets used to refill the bucket back to its target. Theoretically, the equity side never gets sold at a loss in this way.
So how many years of living expenses in bonds avoids a panic sale?
There are two types of downturns here, and they behave differently: corrections and bear markets.
Market corrections - declines of 10-20% - are the common case. According to American Century Investments, they’ve happened about every two and a half years over a 75-year span (1946-2022), averaging a 14% decline. A separate source, IG Wealth Management, puts the full cycle at around 9 months total: roughly 5 months to hit bottom, then about 5 more months to fully recover, for a total of 10 months.
Bear markets - declines of 20% or more - are rarer and worse. The same American Century Investments data shows they’ve happened about every 5 years over the same 75-year period, averaging a 32% decline and taking about a year to hit bottom.
Recovery time after that is where it gets uneven. Looking at every S&P 500 bear market since the index launched in 1957 (11 bear markets in total), most (8 out of 11) recovered in about 3 years or less based on historical S&P 500 index price data: 2020 (7 months), 1966 (1.6 years), 1961-62 (1.8 years), 1987 (1.9 years), 1980-82 and 2022 (2 years each), 2002 (2.7 years), and 1968-70 (3.2 years - close enough to count, since the shortfall is a few months during a market that was already most of the way back). Three didn’t: 2007-08 (5.4 years), 2000-01 (6.8 years), and 1973-74 (7.5 years). Those three aren’t random outliers. They’re the three largest declines in the dataset, which makes sense: a 50% drop needs a 100% gain just to break even, while a 20% drop only needs 25%. The deeper the decline, the harder the math gets, and the longer the climb back takes.
Recovery Timeline and Size of Market Decline for Bear Markets Since 1957
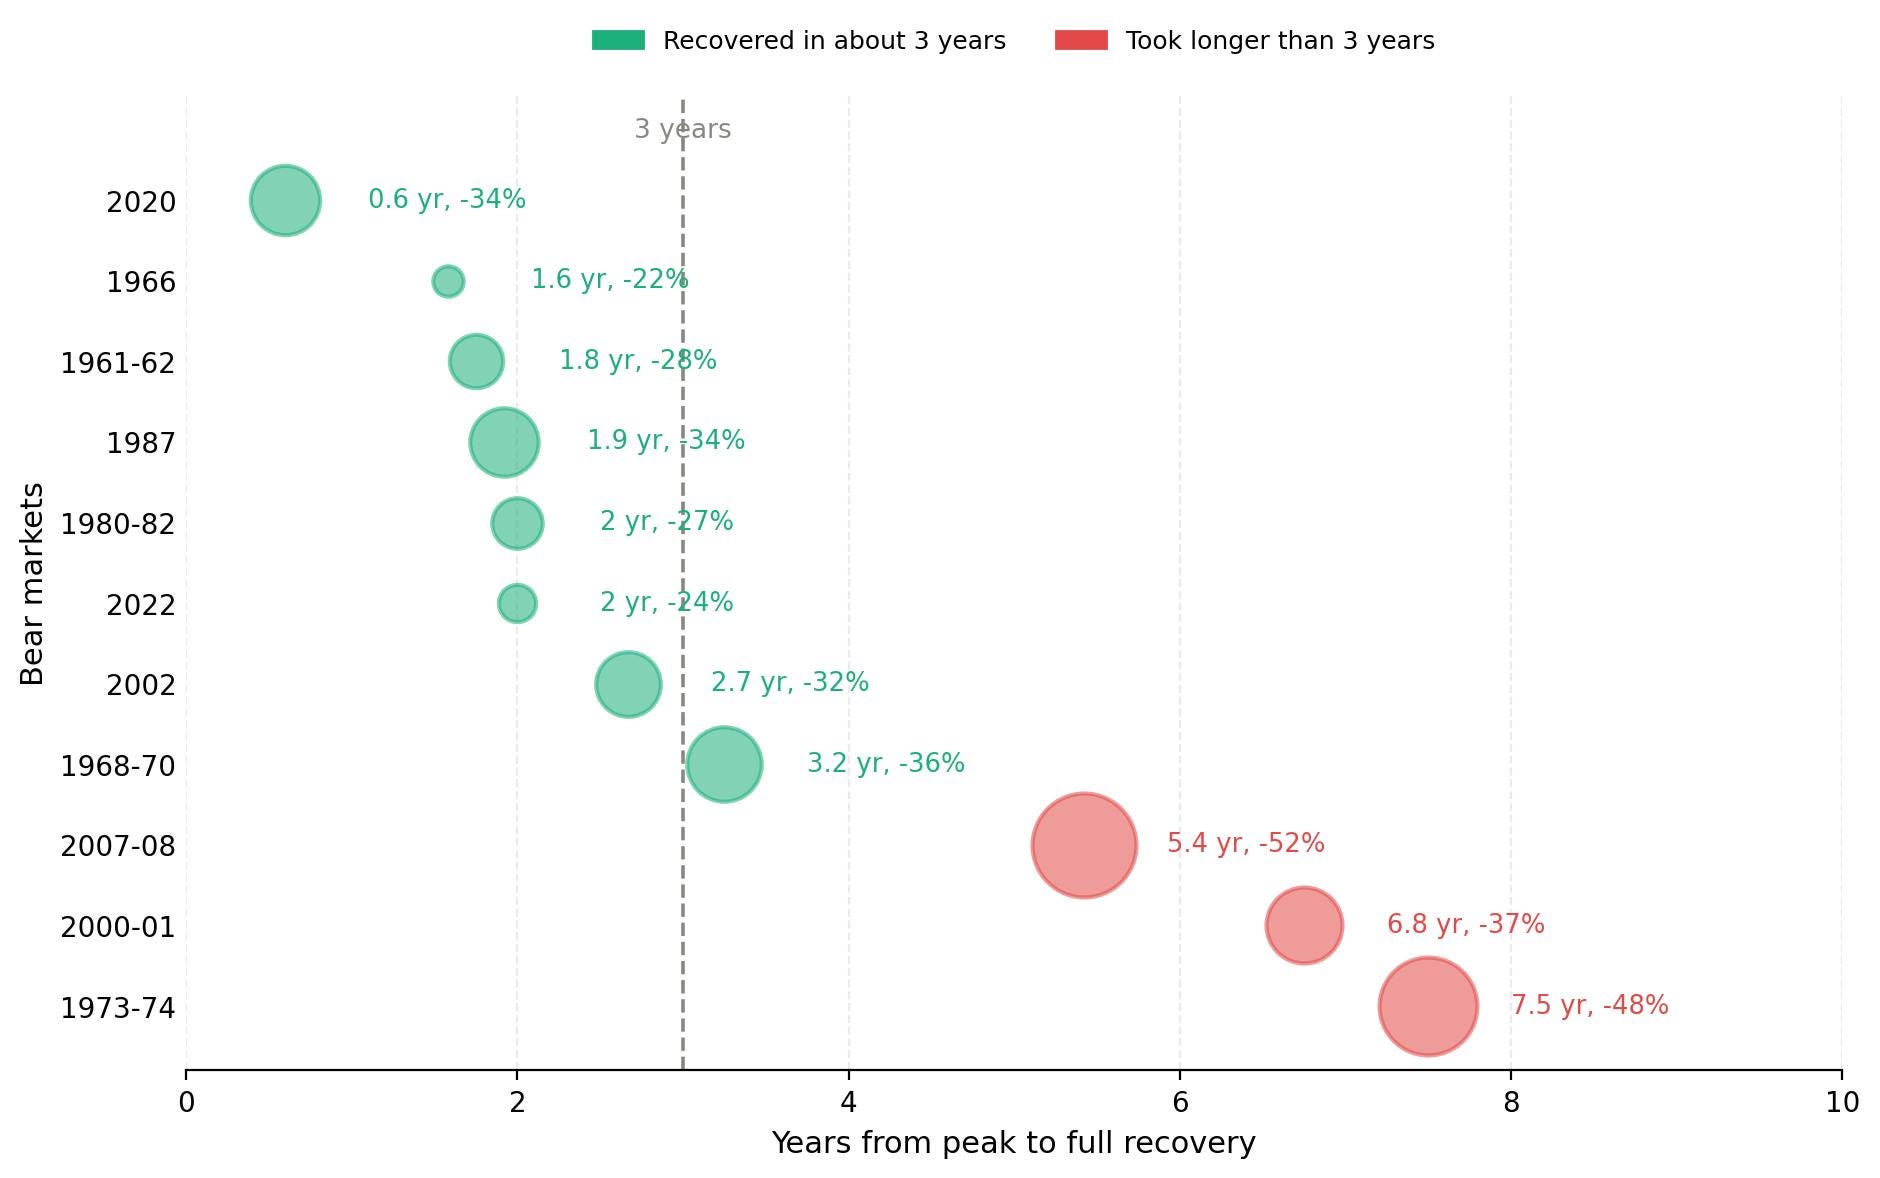
Note: Bubble size represents the magnitude of market decline. Number next to each bubble shows years to recover and the percent of decline. Source: Market decline data is from American Century Investments data cited earlier in the post. Recovery timeline is calculated using historical S&P 500 price data from multpl.com (also cited earlier). The recovery reflects price change only, not total returns, and does not include dividends.
For me personally, I’m comfortable holding three years of living expenses in bonds for retirement. Why? Because three years of expenses in bonds covers every correction and 8 of the 11 bear markets in the S&P 500’s history. It does not cover the other three, which took much longer to recover.
Covering more of that tail is possible, and it’s the same trade-off as buying insurance: more coverage costs more in premium, paid every single year, for protection that in most years won’t be needed. Ten years of expenses - $1.5 million on a $150,000 annual estimate - would have covered every bear market in the S&P 500’s history since 1957, including the worst one on record. On a $5 million portfolio, that’s still just 30%, less than Bogle’s age-65 rule of 65% bonds. The only scenario that would actually require something closer to Bogle’s number is the 1929 crash, a 25-year recovery using reconstructed pre-1957 data - a single, data-limited historical extreme, not a repeated pattern. There’s no objectively correct amount here. It’s a question of how much weight to put on an outlier event like that.
Three years is my own answer, not a rule for anyone else’s portfolio. If three years of living expenses doesn’t fully cover a downturn, I’d rather start selling some equity once it’s off the bottom - even before it’s fully recovered - than hold enough bonds to avoid that entirely. That sale wouldn’t happen at a good price, but the extra return the equity allocation earned in all the years before the crash is what pays for that outcome. Someone more averse to that scenario might reasonably choose 10 years instead, or even Bogle’s 65%. The number isn’t the point. Being aware of what it costs, either way, is.
What holding less in bonds is worth over time
Take a $5 million portfolio, withdrawing $150,000 a year, starting at age 60. Compare two allocations: 40% equity / 60% bonds, and 90% equity / 10% bonds (the case where about 3 years of living expense is in bonds). Withdrawals come out of each portfolio in the same proportion as its starting mix, every year. Equity grows at 10% a year, bonds at 3.5% a year - simplified numbers used to make the math easy to follow, not a prediction of future returns. This assumes any downturn during these 25 years is a correction or a typical bear market that recovers in about 3 years - not one of the three exceptions from the previous section.
Portfolio Value with $5M Initial Value at 60: 40% vs. 10% Bond Allocation
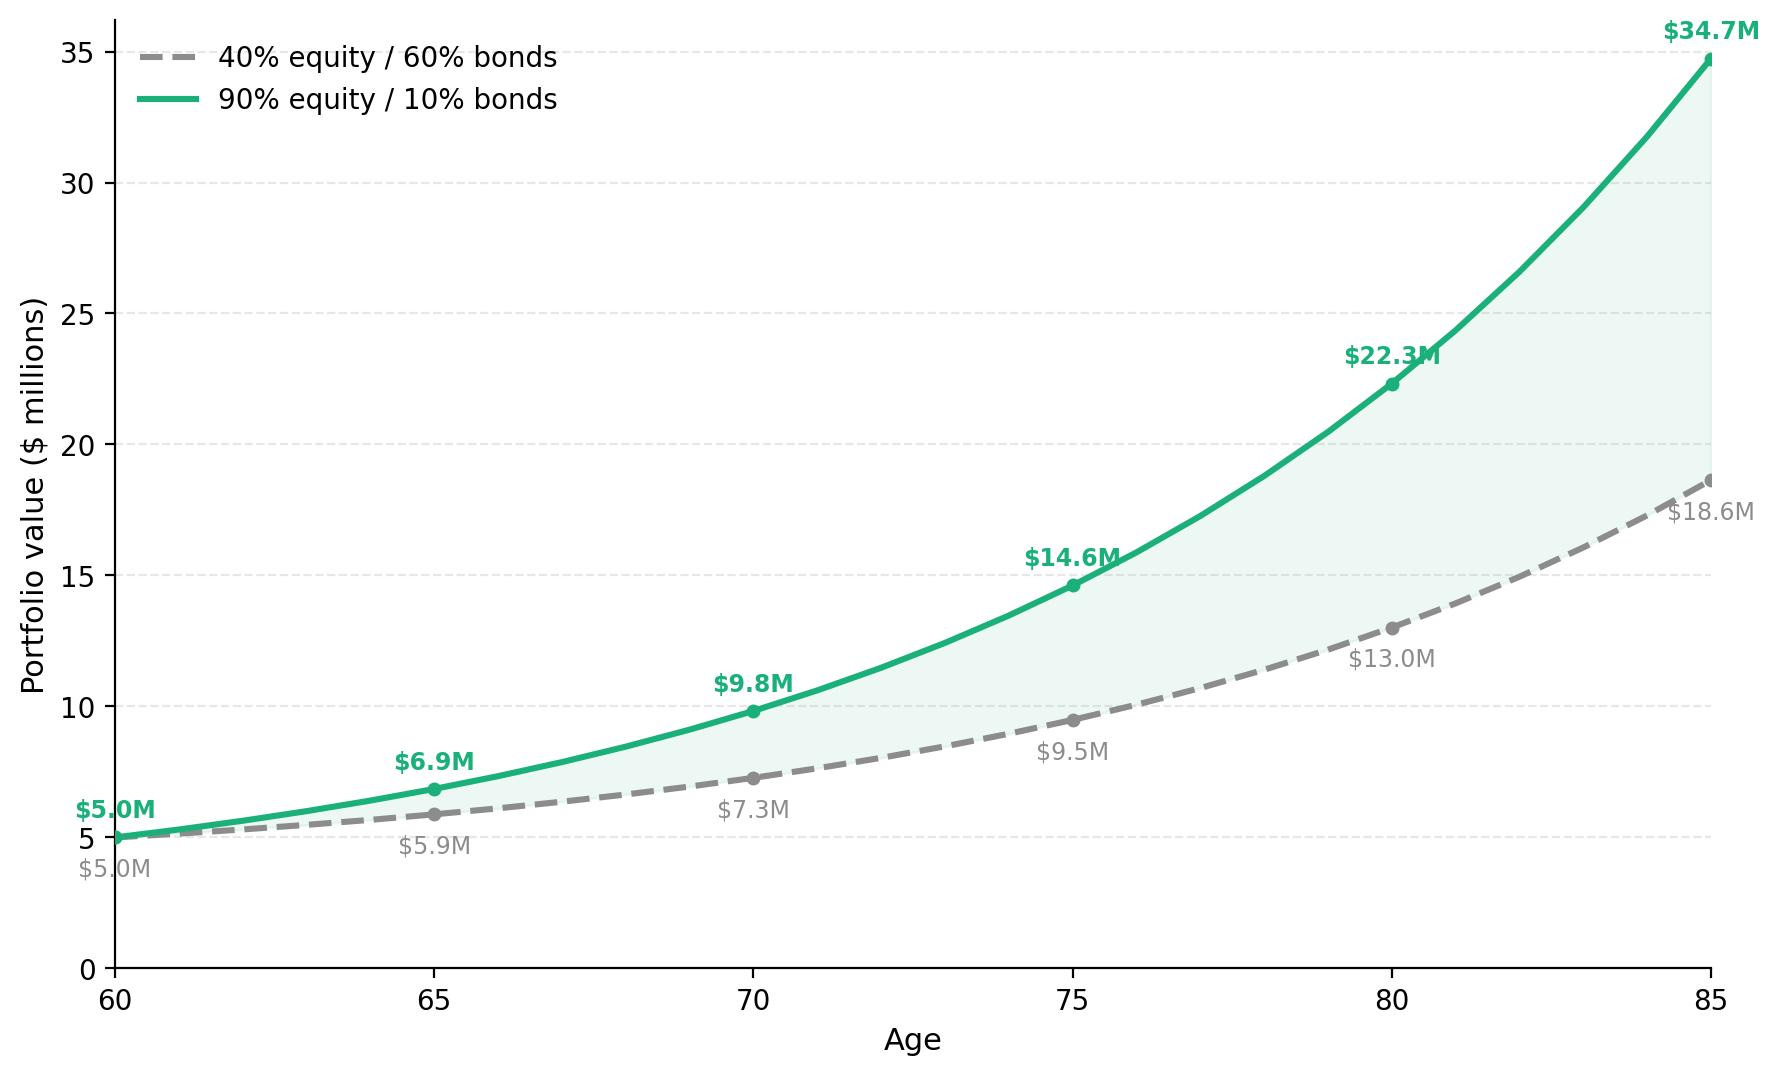
Both portfolios grow, since $150,000 is a modest withdrawal against $5 million. But by age 85, the 90/10 portfolio is worth $34.7 million and the 40/60 portfolio is worth $18.6 million - a $16 million difference, from the same starting point and the same withdrawal. The only thing different between them is how much of each was sitting in bonds instead of equity.
When three years isn’t enough
For the three bear markets that don’t recover within three years, the bucket runs dry before the market’s back. When that happens, equity gets sold at whatever price is available - sometimes still depressed, sometimes partway back, but not at a full recovery. That’s the real cost of the gap.
A home equity line of credit, opened before retirement, can potentially delay that forced sale. Worth being specific about how much it actually helps. A typical HELOC is capped around 80% of home equity. On a $1 million home with no mortgage, that’s roughly $800,000 - enough to cover five years of a $150,000 shortfall, in theory. In practice it could be less: lenders can cut or freeze the limit if home values drop, which tends to happen alongside a bad stock market, and most HELOCs only stay open for a 10-year draw period, not indefinitely. It also isn’t free - interest accrues on whatever’s drawn. $300,000 drawn over two years at a variable rate around 8% runs about $24,000 a year in interest, on top of the $150,000 already being withdrawn.
Rental income, if you have it, solves a different problem, further upstream. It doesn’t delay a forced sale - it shrinks the bucket that was needed in the first place, before any of this comes up. $30,000 a year in net rental income against a $150,000 expense estimate means the bucket only needs to cover $120,000, every year, whether a crash happens or not.
The takeaway
The point isn’t a percentage to remember. It’s a calculation: an honest annual expense estimate, times however many years of cushion feels right, minus any income that keeps coming in during a downturn. Whatever percentage that comes out to - 5%, 9%, 22% - is the right one for that portfolio, and it’s not going to be the same as anyone else’s.
How much of a drop could your portfolio absorb before you’d be forced to sell something at a loss? Hit reply - I’m curious what number you land on.
I am not a financial advisor. Nothing in this newsletter is investment or tax advice. Fine Print Investing publishes weekly.