

What do you know about international stock market?
How much do I actually know about international stock markets? Honestly, not much. I know the London Stock Exchange exists. I know Japan has the Nikkei index. Beyond that, I couldn’t tell you how these markets behave, what drives them, or what their historical patterns look like. I suspect most investors are in the same position - holding international stocks because they were told to, without a clear view of what they’re actually buying.
International stocks show up in many widely followed investing frameworks. One of the most widely followed investing frameworks - the Bogleheads three-fund portfolio - recommends holding three funds: a U.S. broad index, an international index, and a bond index. Not everyone agrees. John Bogle - the man the Bogleheads community is named after - wrote in Common Sense on Mutual Funds that overseas investments “are not essential, nor even necessary, to a well-diversified portfolio,” and recommended capping international at 20% for anyone who insisted on holding it. Warren Buffett’s instructions for the trust that will hold cash for his wife are 90% in a low-cost S&P 500 index fund — not a global index.
And periodically, a new wave of commentary argues that international stocks are about to have their moment. Earlier this year, CFA Institute's Enterprising Investor published an analysis arguing that international markets are improving structurally, valuations are cheaper, and the conditions for a multi-year tailwind in favor of international are falling into place.
I’ve seen versions of this argument before. This time I decided to check it against data. Two specific questions: which market has delivered better returns over time, and does international actually protect you when U.S. markets fall?
The data
I compared historical data for S&P 500 (for US equity market) and EFA (for international market) for this analysis. EFA is the iShares MSCI EAFE ETF, which launched in August 2001 as one of the first ETFs to offer broad exposure to developed international markets. It has tracked the MSCI EAFE Index continuously since inception with no benchmark changes, making August 2001 to June 2026 the full window of this analysis.
MSCI EAFE stands for Europe, Australasia, and the Far East. It covers large and mid-cap stocks across 21 developed markets - the UK, Japan, France, Germany, Switzerland, Australia, and others. It excludes the United States, Canada, and all emerging markets - no China, India, or Brazil. Someone holding a broader fund that includes emerging markets may see different results.
A fund covering both developed and emerging markets would offer broader scope, but the available options all launched too recently to cover the market crashes that matter most. The popular total-market funds and ETFs - such as Vanguard Total International Stock Index Fund Admiral Shares (VTIAX), Vanguard Total International Stock ETF (VXUS), and iShares Core MSCI Total International Stock ETF (IXUS) - were all launched between late 2010 and 2012, much later than EFA. This timeline is simply too short for a meaningful crash analysis. Older mutual funds like Vanguard Total International Stock Index Fund Investor Shares (VGTSX) and Schwab International Index Fund (SWISX) do cover a longer period, but their historical price data is affected by mutual fund distribution reporting, making a clean, price-only comparison to the S&P 500 impossible.
S&P 500 monthly average prices come from multpl.com, sourced from Robert Shiller’s long-run dataset and Standard & Poor’s. EFA daily closing prices come from Yahoo Finance, averaged to monthly figures using the same methodology. Both are price-only - dividends excluded on both sides. International stocks have generally paid higher dividends than U.S. stocks, while U.S. companies have favored share buybacks as a way to return capital to shareholders. Incorporating total return may narrow the recovery times and the growth gap in this analysis. The directional findings hold, but the magnitudes may be smaller.
What the data shows
I looked at two hypotheses: first, that international protects you during a crash in the U.S. market, and second, that it delivers better returns over full cycles. Here's what actually happened across 25 years and five crashes.
Crash protection
The case for holding international as crash protection rests on the idea that the U.S. and other economies run on different cycles - a U.S.-specific downturn shouldn't hit international stocks the same way at the same time. Hold both, the theory goes, and when one falls the other cushions the impact.
I looked at every U.S. bear market between 2001 and 2026. Using the standard definition of a 20% or more decline from a prior peak - as applied by American Century Investments in their market analysis — five bear markets happened inside this window:
January 4 – July 23, 2002
October 9, 2007 – November 20, 2008
January 6 – March 9, 2009
February 19 – March 23, 2020
January 3 – June 16, 2022
The chart below shows two things for each crash: how far each index fell from peak to trough on the left, and how many years it took each index to fully recover on the right.
Peak-to-Trough Decline and Years to Full Recovery: S&P 500 vs. EFA
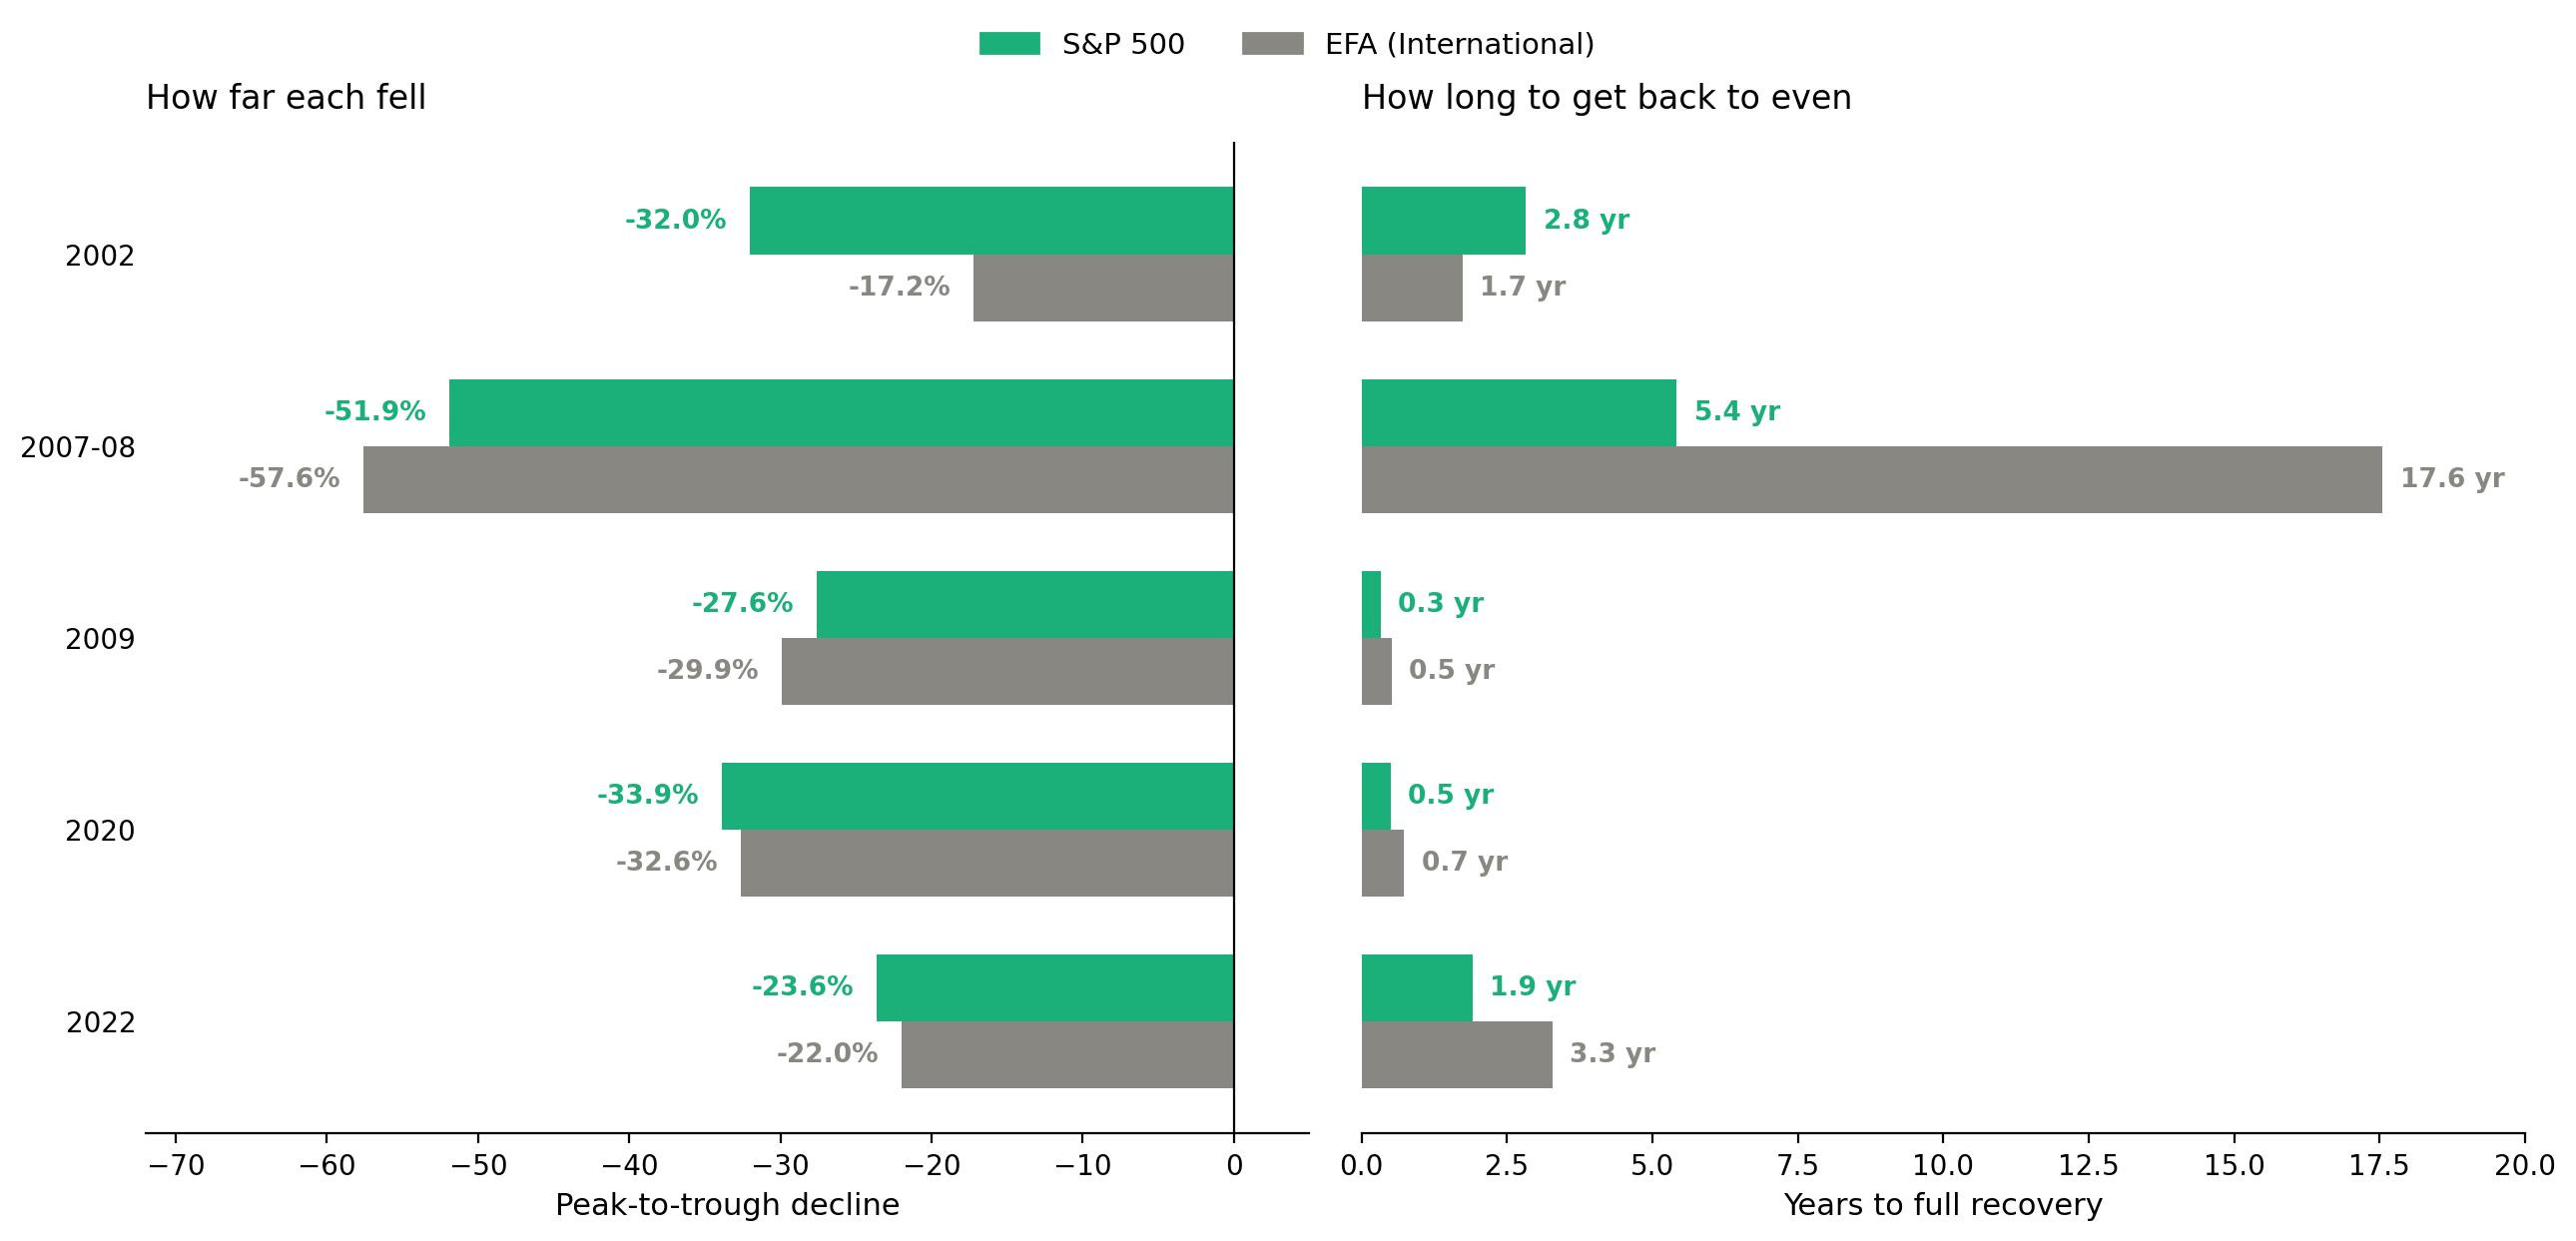
Sources: S&P 500 decline figures from American Century Investments. EFA decline figures calculated from Yahoo Finance daily closing prices. Recovery times calculated from multpl.com monthly S&P 500 data and Yahoo Finance daily EFA data, using a 90-day durability check to confirm durable recovery. All figures are price-only. The 2009 event is measured from its own January 2009 starting price, not the 2007 high - which is why its recovery appears short despite being part of a broader crisis.
The result was the same every time: when the U.S. fell, international fell too. Not once did the U.S. drop while international held steady or went up.
Look at the pattern more carefully. In three of the crashes - 2009, 2020, and 2022 - the declines were broadly similar between the two indexes, offering no meaningful cushion. In 2002, international fell about half as much as the U.S., but still dropped 17% - a significant decline by any measure. And in 2007–08, the crash where protection mattered most, international fell harder than the U.S. - 57.6% versus 51.9%.
The recovery picture is just as stark. In 2009 and 2020, both markets recovered quickly and in roughly the same amount of time. International actually notched a win in 2002, fully recovering in 1.7 years compared to 2.8 years for the U.S. But in 2022 and 2007–08, international took significantly longer. In 2022, international needed 3.3 years to recover versus 1.9 years for the U.S. In 2007–08, the gap was even wider: 17.6 years for international versus 5.4 years for the U.S. - more than three times as long.
The crash protection case for international diversification, tested against 25 years of real data, did not hold up.
Return
Growth of $100 Invested in August 2001: S&P 500 vs. EFA
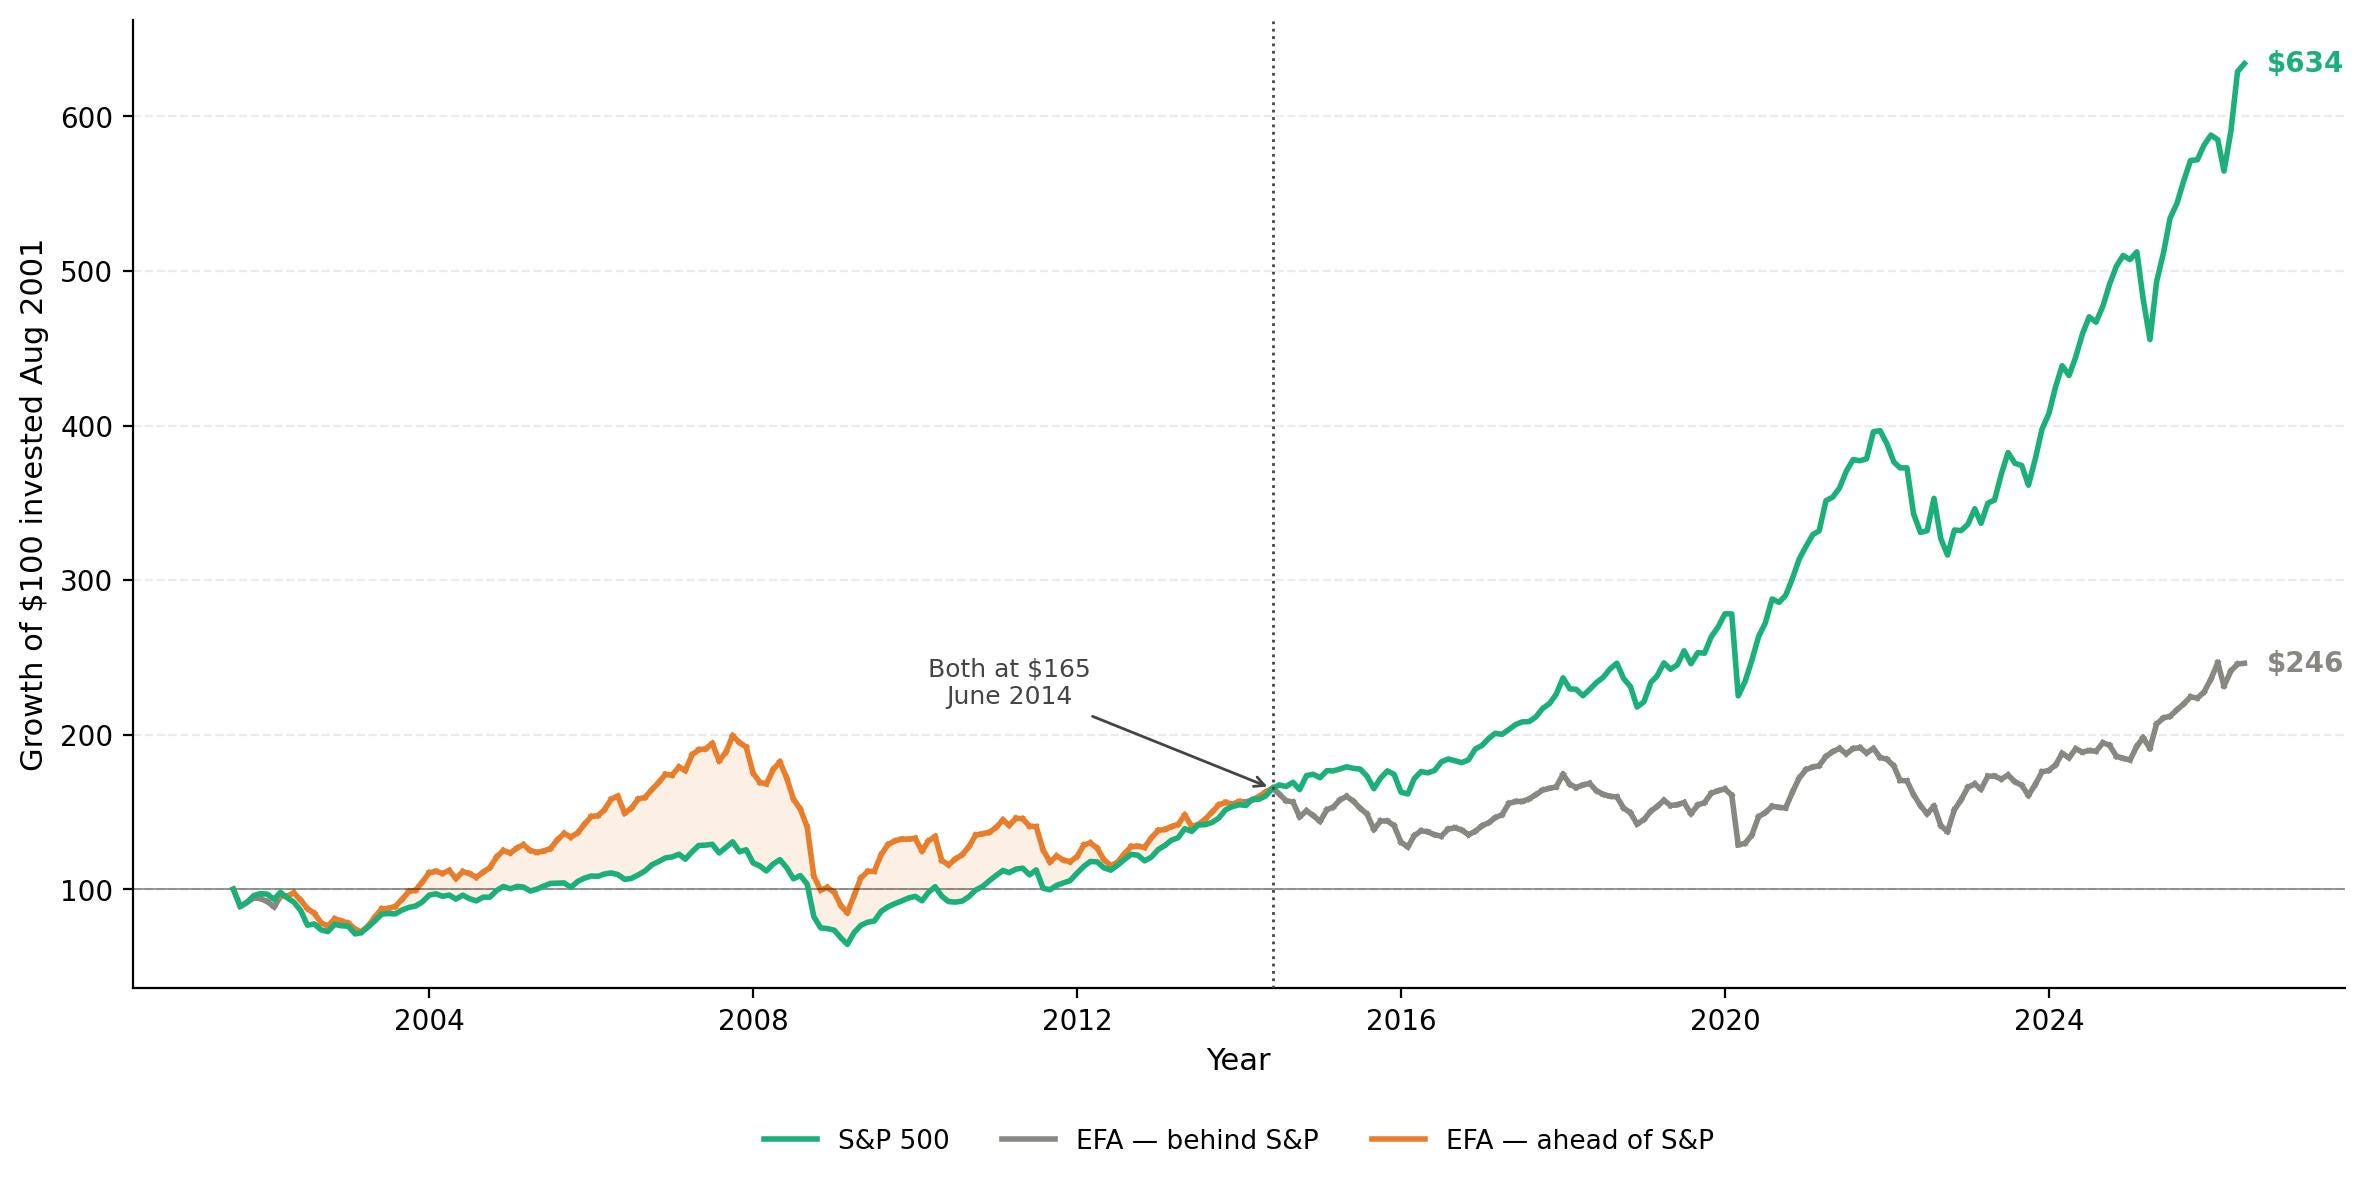
Sources: S&P 500 monthly average prices from multpl.com; EFA daily closing prices from Yahoo Finance, averaged to monthly figures using the same methodology. Both series are price-only, dividends excluded. A total return comparison would narrow the gap but not reverse it.
The chart above tracks the growth of $100 invested in each index starting in August 2001. $100 invested in the S&P 500 in August 2001 was worth $634 by June 2026. The same $100 in EFA was worth $246. Over the full 25-year period, the S&P won by a wide margin.
But the chart tells a more nuanced story than the ending values in 2026 suggest. For the first nearly 13 years - from August 2001 through June 2014 — EFA was ahead of the S&P on a cumulative basis for most of the time. At its peak lead in November 2007, EFA had turned $100 into $195. The S&P had turned the same $100 into $124. That’s a 70-point lead, built over six years of dollar weakness and a global commodity and value-stock cycle that heavily favored international markets.
Then 2007–08 happened. EFA fell 57.6% from peak to trough. The S&P fell 51.9%. EFA’s 70-point lead collapsed to 20 points by March 2009. The S&P recovered faster. By June 2014 - nearly 13 years after the comparison started - both indexes had reached the same place: $165 on a $100 initial investment. International’s entire lead had been erased by one crash.
From there, the U.S. pulled away for good. A strong dollar and U.S. technology leadership drove the S&P from $165 to $634 over the next 12 years. EFA went from $165 to $246.
The case for holding international based on that pre-2008 leadership period has a major problem: capturing it required near-perfect timing. An investor would have needed to buy in August 2001 and exit before the November 2007 peak to capture the full 70-point lead before the crash gave it back. But anyone with the foresight to exit international before the 2008 crash would have been just as well served exiting U.S. equities at the same time - the 2008 crash hit both markets.
And even if the timing had worked, the longer historical record doesn’t make a return case for international either. The same CFA Institute piece, citing Bloomberg data, shows that over the four decades before the Global Financial Crisis, U.S. and international markets produced broadly similar annualized returns. Not international leading. Not U.S. leading. Broadly similar. If returns are broadly similar over a full multi-decade cycle, adding international means taking on additional currency risk, higher complexity, and - as the crash data above shows - worse recovery times in the worst events, for no return advantage.
The takeaway
Based on 25 years of data and five crashes, the case for holding international in my own portfolio doesn't hold up. The crash protection hypothesis failed every single time - international markets fell alongside the U.S. in all five events, and fell harder in the biggest crash. They often took longer than the U.S. market to recover - sometimes significantly longer. The return hypothesis failed once you account for timing: the one real period of international leadership required near-perfect entry and exit to capture, and the 2008 crash erased most of it anyway. And over the four decades before the Global Financial Crisis, returns were broadly similar on both sides — meaning even the longer historical record doesn't make a return case for the added complexity.
What’s the strongest argument you’ve heard for holding international? Hit reply - I’m curious whether it’s one of the two I tested here or something else entirely.
I am not a financial advisor. Nothing in this newsletter is investment or tax advice. Fine Print Investing publishes weekly.